For the Nieuw Allardsoog website Meinte Strikwerda drew a beautiful illustration of the estate. The goal of this post is to make the below illustration interactive, zoomable, and filled with interactive points of interest.
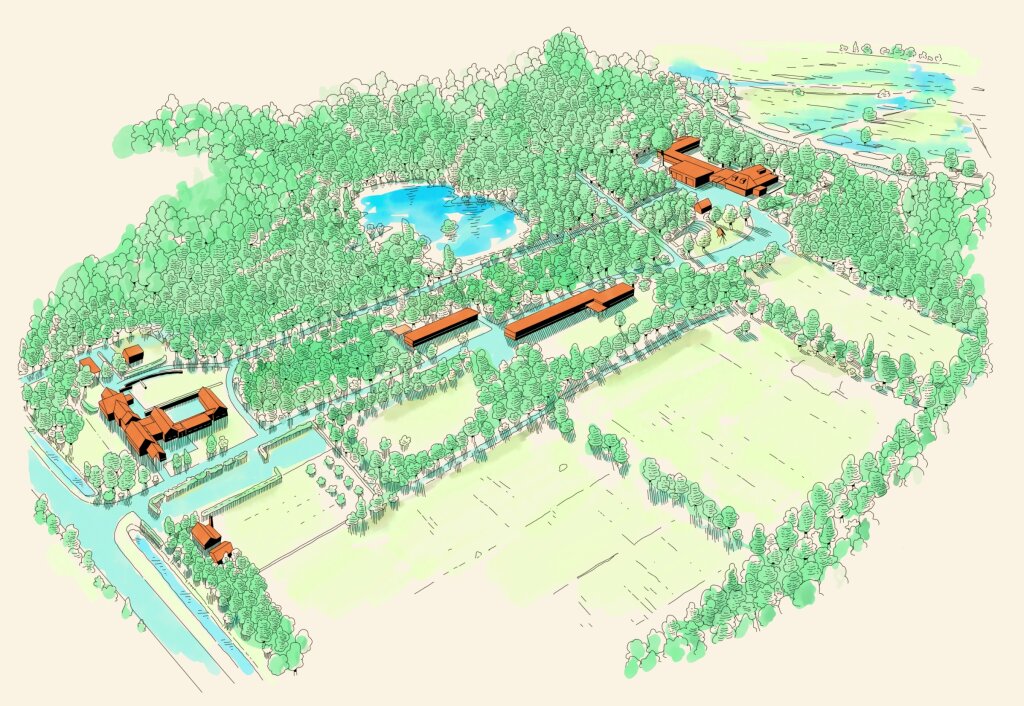
In the end I ended up with the following result. A completely interactive, tiled, zoomable map with points of interests visitors can explore.
What do we need to do
In order to render a custom interactive map using Statamic you need to do a few things. For this post you should have some knowledge on Statamic and Javascript.
These are the steps we need to take:
Tiling the map
Initiate Mapbox
Combine Statamic and Mapbox
Icing on the cake
Tiling the map
To let Mapbox use a custom map instead of a geographical world map you have to generate squared tiles for various zoom levels. To automate this you can use a CLI tool called Maptiles. Since this is probably a one-off thing you don't have to worry about installing it in your $PATH but simply reference the shell script directly. Run the following command in your terminal.
1sh maptiles map.png --square --format jpg --optimise lossless --background '#FAF3E4' ./mapboxThis will convert map.png to whole bunch of tiles in the folder ./mapbox. The files will be squared, lossless and jpg's. With the background flag you define a background color to the tiles when there's no art on that square. The tiles will be enclosed in folders with the zoom level as their name:
1\tiles2\tiles\0\3\tiles\0\tile_0_0.jpg4\tiles\1\5\tiles\1\tile_0_0.jpg6\tiles\1\tile_0_1.jpg7\tiles\1\tile_1_0.jpg8\tiles\1\tile_1_1.jpg9...Put all those files somewhere in the public folder of your Statamic install or on a CDN.
Initiating Mapbox
Mapbox is commercial software but you can use it for free until 50.000 views per month. The advantage of Mapbox is that it's not a Google product and that it's very good looking and customizable. Create an account and set up an access token.
For this feature you need the Mapbox GL JS scripts. Include these in the partial where you'll be rendering the final map. I'm rendering the partial on each page. In the end I use a JS event so that the modal and map can be opened from anywhere.
1<link href="https://api.mapbox.com/mapbox-gl-js/v2.4.1/mapbox-gl.css" rel="stylesheet">2<script src="https://api.mapbox.com/mapbox-gl-js/v2.4.1/mapbox-gl.js"></script>In order to use our Access Token from a .env variable we have to add an array to the Laravel services config file. This is config/services.php. Add the following:
1'mapbox' => [2 'key' => env('MAPBOX_KEY'),3]Now you can add MAPBOX_KEY=YOUR_ACCESS_TOKEN to your .env file.
Now everything is setup you can start by using AlpineJS to initiate the map.
1// Load the Access Token. 2mapboxgl.accessToken = '{{ config:services:mapbox:key }}' 3const map = new mapboxgl.Map({ 4 container: 'map', 5 style: { 6 'version': 8, 7 'sources': { 8 'raster-tiles': { 9 'type': 'raster',10 'tiles': [11 // Use the custom map tiles. 12 'PATH_TO_YOUR_TILES/{z}/tile_{x}_{y}.jpg'13 ],14 // Divide the actual tile size in pixels by 2 to support retina displays. 15 'tileSize': 128,16 'attribution': ''17 }18 },19 'layers': [20 {21 'id': 'simple-tiles',22 'type': 'raster',23 'source': 'raster-tiles',24 // Set the amount of zoom levels (folders) available in your tileset. 25 'minzoom': 0,26 'maxzoom': 627 }28 ]29 },30 renderWorldCopies: false,31 // Default zoom.32 zoom: 2,33 // The minimum zoom available.34 minZoom: 2,35 // The maximum zoom available.36 maxZoom: 537})So what's happening here?
L12 I reference the previously generated tiles. Make sure to update the path.
L15 I set the tile size. As the generated images are actually
256px x 256pxI want to render them at128px x 128pxto support retina displays.L25:26 I set the amount of zoom levels available in our tile set. This the amount of zoom folders that get generated:
[0] [1] [2] [3] [4] [5] [6].L32:36 I configure the default zoom level and the amount of zoom levels I want the user to be able to control. Note: this will make the tiles in the unused zoom levels redundant.
After setting up this basis you can set some specific UI options.
1// Disable the UI compass. 2const nav = new mapboxgl.NavigationControl({ 3 showCompass: false 4}) 5 6// Add controls to the bottom right of the map. 7map.addControl(nav, 'bottom-right') 8 9// Disable rotation.10map.touchZoomRotate.disableRotation()11map.dragRotate.disable()I like the interface as clean as possible so I configure the following.
L3 Disable compass UI.
L7 Move the zoom controls to the bottom right.
L10:11 Disable rotation. It makes no sense for users being to rotate such a map. I also disable rotation via drag gestures on touch devices.
Combine Statamic and Mapbox
The next step is to generate dots on the map that serve as points of interest the user can click on. I decided to generate a Statamic Collection for this to make adding points to the map a breeze. I created a collection called called map_features. Depending on your needs your collection blueprint might look different, but this is a screenshot of the editing experience for my collection.
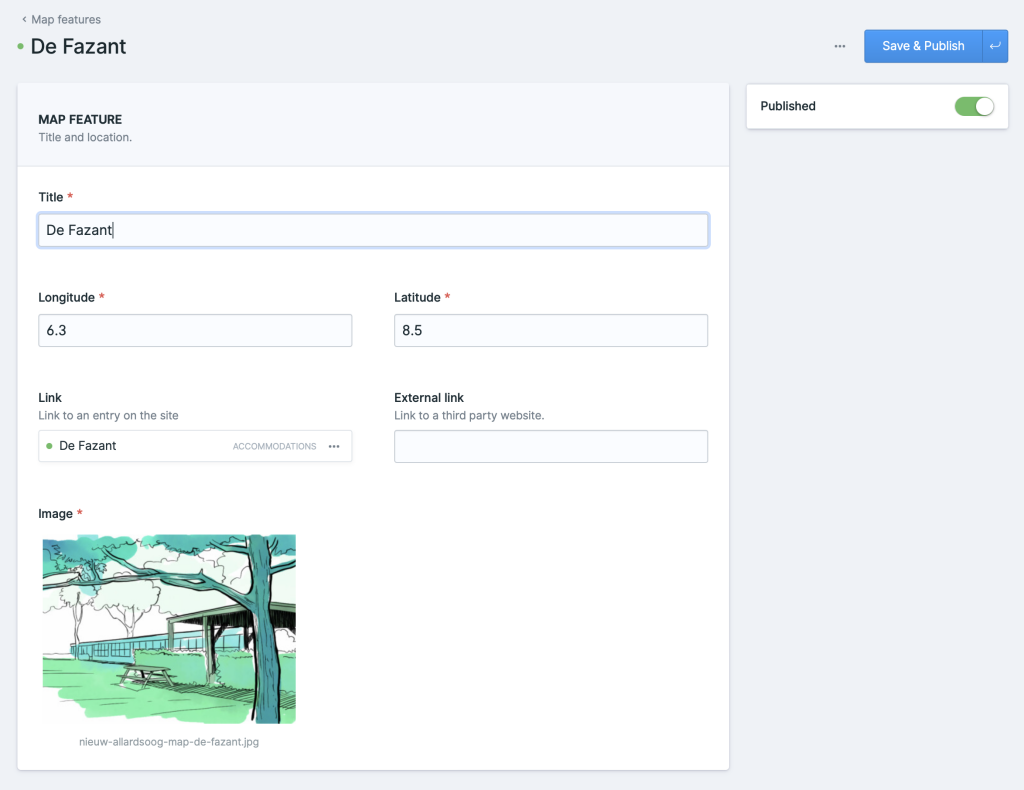
You might note that each entry will get longitude and latitude values. Mapbox needs to know where on the map you want a certain dot plotted. So we need to find a way to get those values. For this I added this snippet to my partial:
1{{ if environment == 'local' }}2 map.on('mousemove', (e) => {3 console.log(JSON.stringify(e.lngLat.wrap()))4 })5{{ /if }}This way when you inspect the map (on a local environment) and hover over it you get live coordinates of where we you're hovering. Handy! Simply copy the values for each point of interest and add them as a collection entry with all the other fields you need for your project.
The last thing we need to do is instruct Mapbox to plot those points of interest on the map. First we should define how our dots on the map visually look. I copied and tweaked an example from the Mapbox Documentation that ended me up with following code.
1// This implements `StyleImageInterface` to draw a pulsing dot icon on the map. 2const pulsingDot = { 3 width: 200, 4 height: 200, 5 data: new Uint8Array(size * size * 4), 6 7 // When the layer is added to the map, get the rendering context for the map canvas. 8 onAdd: function () { 9 const canvas = document.createElement('canvas')10 canvas.width = this.width11 canvas.height = this.height12 this.context = canvas.getContext('2d')13 },14 15 // Call once before every frame where the icon will be used.16 render: function () {17 const duration = 120018 const t = (performance.now() % duration) / duration19 20 const radius = (size / 2) * 0.321 const outerRadius = (size / 2) * 0.7 * t + radius22 const context = this.context23 24 // Draw the outer circle.25 context.clearRect(0, 0, this.width, this.height)26 context.beginPath()27 context.arc(this.width / 2, this.height / 2, outerRadius, 0, Math.PI * 2)28 context.fillStyle = `rgba(255, 200, 200, ${1 - t})`29 context.fill()30 31 // Draw the inner circle.32 context.beginPath()33 context.arc(34 this.width / 2,35 this.height / 2,36 radius,37 0,38 Math.PI * 239 )40 context.fillStyle = '#4C2D6D' 41 context.strokeStyle = '#B98BE9'42 context.lineWidth = 2 + 4 * (1 - t)43 context.fill()44 context.stroke()45 46 // Update this image's data with data from the canvas.47 this.data = context.getImageData(48 0,49 0,50 this.width,51 this.height52 ).data53 54 // Continuously repaint the map, resulting in the smooth animation of the dot.55 map.triggerRepaint()56 57 // Return `true` to let the map know that the image was updated.58 return true59 }60}This snippet is using the canvas API to draw a pulsating dot optimized for retina screens. You can read the original documentation on this. The most important thing you'd want to change is the coloring to match your projects branding on L40:41.
For each collection entry this dot needs to be rendered. You can do this by simply looping over your collection with Antlers tags.
1map.on('load', () => { 2 map.addImage('pulsing-dot', pulsingDot, { pixelRatio: 2 }) 3 4 map.addSource('features', { 5 'type': 'geojson', 6 'data': { 7 'type': 'FeatureCollection', 8 'features': [ 9 // Use Antlers to loop over our map_features collection. 10 {{ collection:map_features }}11 {12 'type': 'Feature',13 'properties': {14 // Define the HTML that should be rendered when a user clicks.15 'description': '<div class="absolute flex flex-col font-serif py-1 px-8 bottom-0 inset-x-0 text-center mb-6 bg-neutral-400/70"><h3 class="text-creme font-bold text-sm">{{ title }}</h3>{{ if entry || external_link }}<a class="text-creme font-bold text-xs underline" href="{{ entry:url ?? external_link }}" {{ if external_link }} target="_blank" {{ /if}} aria-label="Read more about {{ title }}">Read more</a>{{ /if }}</div><img class="w-full h-full" src="{{ glide src="{{ image }}" width="600" height="600" fit="crop_focal" }}" alt="{{ image:alt }}" aria-hidden="true">'16 },17 'geometry': {18 'type': 'Point',19 'coordinates': [{{ longitude }}, {{ latitude }}]20 }21 },22 {{ /collection:map_features }}23 ]24 }25 })26 map.addLayer({27 'id': 'features',28 'type': 'symbol',29 'source': 'features',30 'layout': {31 'icon-image': 'pulsing-dot'32 }33 })34})The most important bit here is L9:16. I'm using the Statamic collection tag to fetch all of our map features.
L15 is the HTML that should be visible whenever the dot gets clicked on in the next step. I'd probably put this HTML in a separate partial for clarity next time.
On L19 we instruct Mapbox on which coordinates to render the pulsating dot (L35).
To make sure to get a pointer cursor when the user hovers over a pulsating dot add the following.
1// Change the cursor to a pointer when the mouse is over the places layer.2map.on('mouseenter', 'features', () => {3 map.getCanvas().style.cursor = 'pointer'4})5 6// Change it back to a pointer when it leaves.7map.on('mouseleave', 'features', () => {8 map.getCanvas().style.cursor = ''9})The map is almost done. The last thing you should do is make the dots interactive and to let them show the primitive HTML we wrote in the snippet above. This snippet is also based on the great Mapbox documentation.
1// When a click event occurs on a feature in the places layer, open a popup at the 2// location of the feature, with description HTML from its properties. 3map.on('click', 'features', (e) => { 4 // Copy coordinates array. 5 const coordinates = e.features[0].geometry.coordinates.slice() 6 const description = e.features[0].properties.description 7 8 // Ensure that if the map is zoomed out such that multiple 9 // copies of the feature are visible, the popup appears10 // over the copy being pointed to.11 while (Math.abs(e.lngLat.lng - coordinates[0]) > 180) {12 coordinates[0] += e.lngLat.lng > coordinates[0] ? 360 : -36013 }14 15 map.flyTo({16 center: e.features[0].geometry.coordinates17 })18 19 new mapboxgl.Popup()20 .setLngLat(coordinates)21 .setHTML(description)22 .addTo(map)23 }24)What happens here is the following.
L4:6 On click get the
coördinatesanddescription(the HTML) from the pulsating dot.L8:13 Zoom out the map so the popup will fit.
L15:17 Center the map on the clicked dot.
L19:23 Render the Mapbox Popup using the
coördinatesanddescription.
Icing on the cake
The map on the Nieuw Allardsoog site renders in a modal. For this we can use AlpineJS. I use the following markup.
1<section 2 x-data="map()" 3 x-bind="component" 4 x-cloak 5 class="relative z-50" 6> 7 <div class="fixed inset-0 bg-neutral motion-safe:transition-opacity motion-safe:duration-600"> 8 9 <div class="fixed inset-4 md:inset-6 lg:inset-8 bg-creme rounded-md overflow-hidden">10 <div class="relative w-full h-full">11 <div id="map" class="relative w-full h-full bg-creme"></div>12 </div>13 </div>14 15 <button16 x-bind="button"17 class="absolute top-2 right-2 md:top-4 md:right-4 lg:top-6 lg:right-6 w-10 h-10 flex items-center justify-center rounded shadow bg-primary-600 hover:bg-primary-400 active:bg-primary-600 border-t border-b border-t-white/10 border-b-black/10 focus:outline-none focus-visible:ring ring-primary motion-safe:transition-colors"18 aria-label="Close map"19 >20 {{ svg:close class="w-5 h-5 text-creme stroke-current" alt="" aria-hidden="true" }}21 </button>22</section>Note that we're spreading all the Alpine properties using x-bind. This will separate concerns in our partial a little and it gives us syntax highlighting.
And the following JS logic.
1window.map = function () { 2 return { 3 // The modal is closed by default. 4 open: false, 5 // The map should only be rendered once. 6 rendered: false, 7 component: { 8 // Show the modal when this.open. 9 'x-show'() {10 return this.open11 },12 // Open the map from a URL hash. 13 'x-init'() {14 return window.location.hash === '#map'15 ? (this.open = true, this.$nextTick(() => { setTimeout(() => { this.renderMap(), this.rendered = true }, 300) }))16 : this.open = false17 },18 // Update the URL hash.19 'x-effect'() {20 return this.open21 ? history.pushState({}, '', '#map')22 : history.pushState({}, '', window.location.pathname)23 },24 // Focus trap the modal.25 'x-trap.inert.noscroll'() {26 return this.open27 },28 // Listen to an open-map event and when it's dispatched open the modal and render the map. 29 '@open-map.window'() {30 return this.rendered31 ? this.open = true32 : (this.open = true, this.$nextTick(() => { setTimeout(() => { this.renderMap(), this.rendered = true }, 300) }))33 },34 // Close the map with escape.35 '@keydown.window.escape'() {36 this.open = false37 }38 },39 button: {40 // The close button in the modal.41 '@click'() {42 this.open = false43 }44 },45 renderMap() {46 // All of the above Mapbox logic.47 }48 }49}For me AlpineJS makes interactivity like this so easy to implement. Let's dive into a few more complex lines.
L6 Mapbox should only be initiated once and not again when a user opens the modal for the second time.
L12:23 Use the
historyAPI to update and listen to the URL. Whenever the hash#mapis in the URL the modal should open automatically. This is being taken care of inx-init. It renders the map after a little delay to make sure the modal is fully rendered. We also setthis.renderedto true so the map doesn't need to be initialized again later on. Thex-effectattribute takes care of removing the hash from the URL whenever to modal is closed.L28:33 Whenever the
open-mapevent is dispatched the modal will open and if the map hasn't been rendered yet the functionrenderMap()will run as well.
To dispatch this event add the following AlpineJS code on any button on your site.
1<button x-data="" @click.prevent="$dispatch('open-map')">2 Open map3</button>And that's it. We've added a fully custom map to our website and use live data from Statamic to make it interactive. Check out the live result here.
If you liked this post or have any comments, please let me know.